The lab digitalization maturity curve: where do you stand?
A roadmap for bringing science to your data, and making it AI/ML ready.
Increasingly everything in the life sciences comes down to data, which is why it needs to be well managed, well stored, well analyzed, and—frankly—well valued. When data isn’t handled properly, labs run into a whole range of different issues, from inefficient lab operations, to issues with reproducibility and scaling, all the way to outright examples of fraud in the most extreme cases.
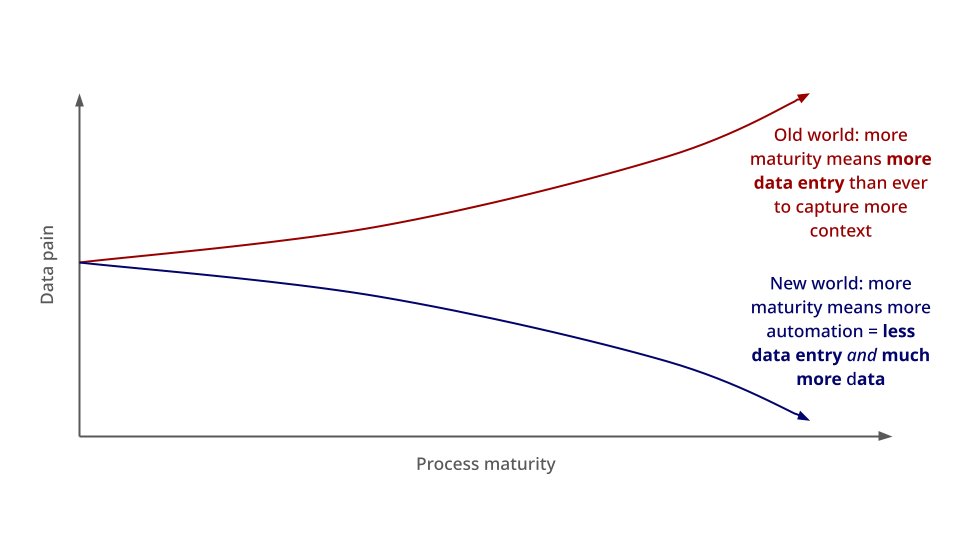
Data integrity and reproducibility are not the only benefits of good data management practices. Consider that data scientists typically spend ~60% of their time on data cleaning and organization. Based on our experience, wet lab scientists spend a similarly significant percentage of their time on data entry, data management, and searching. We consistently hear anecdotes of "ELN days," when scientists spend hours every week simply copy-pasting their results in (assuming they remember everything they did accurately).
With modern data infrastructure, the daily frustrations dealing with data wrangling can be drastically minimized. That’s why labs need to embrace digitalization to get data under control and make it less painful. In short: data management in wet labs needs to "grow up".
What do we mean by lab digitalization? Without oversimplifying, we mean the act of using software—usually Software as a Service (SaaS) or Platform as a Service (PaaS) tools—to systematically capture, manage, and automate data that humans currently need to do by hand.
Today, most biotech organizations have embraced some degree of digitalization. But to become a true digital lab leader (or at least stay ahead of the data pain curve), there’s a lot to do. Read on for a handy guide to figure out where your team stands and how it can grow into the next stage.
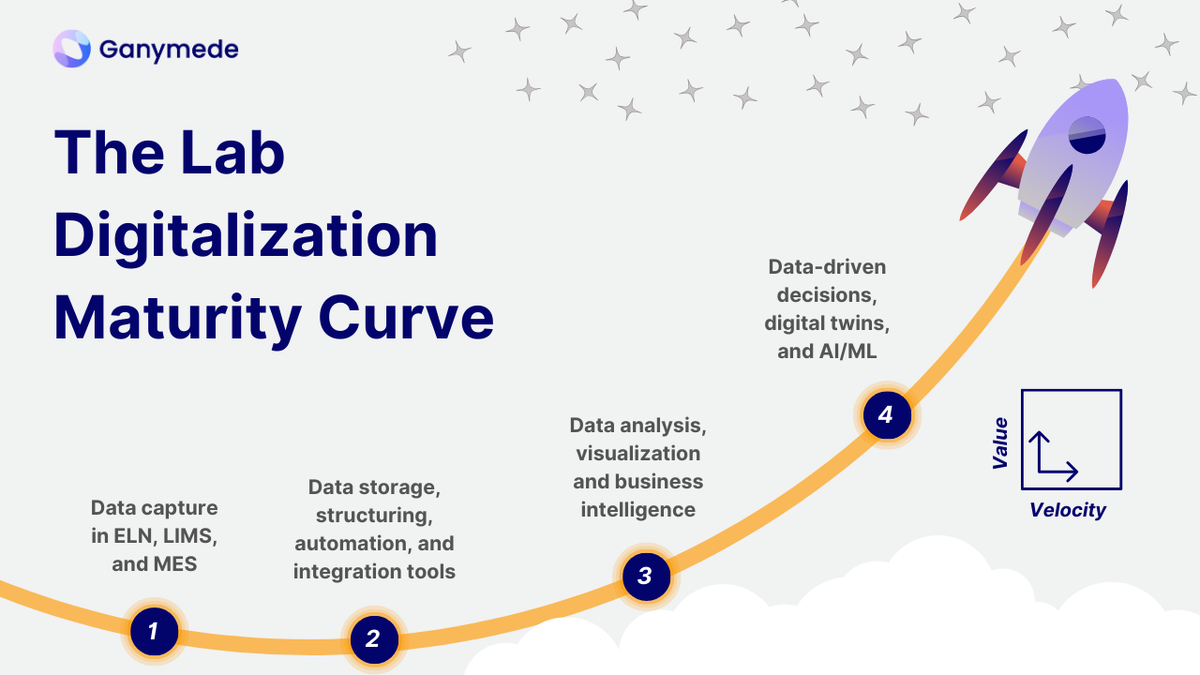
The Lab Digitalization Maturity Curve
To help, Ganymede is introducing our take on a concept that's well established across other industry verticals: the maturity curve.
Databricks, for example, has a great way of communicating how mature companies are when it comes to their data, as well as the impact this has on their ability to deploy artificial intelligence (AI) and gain competitive advantages in the marketplace. They call it the "Data Maturity Curve".

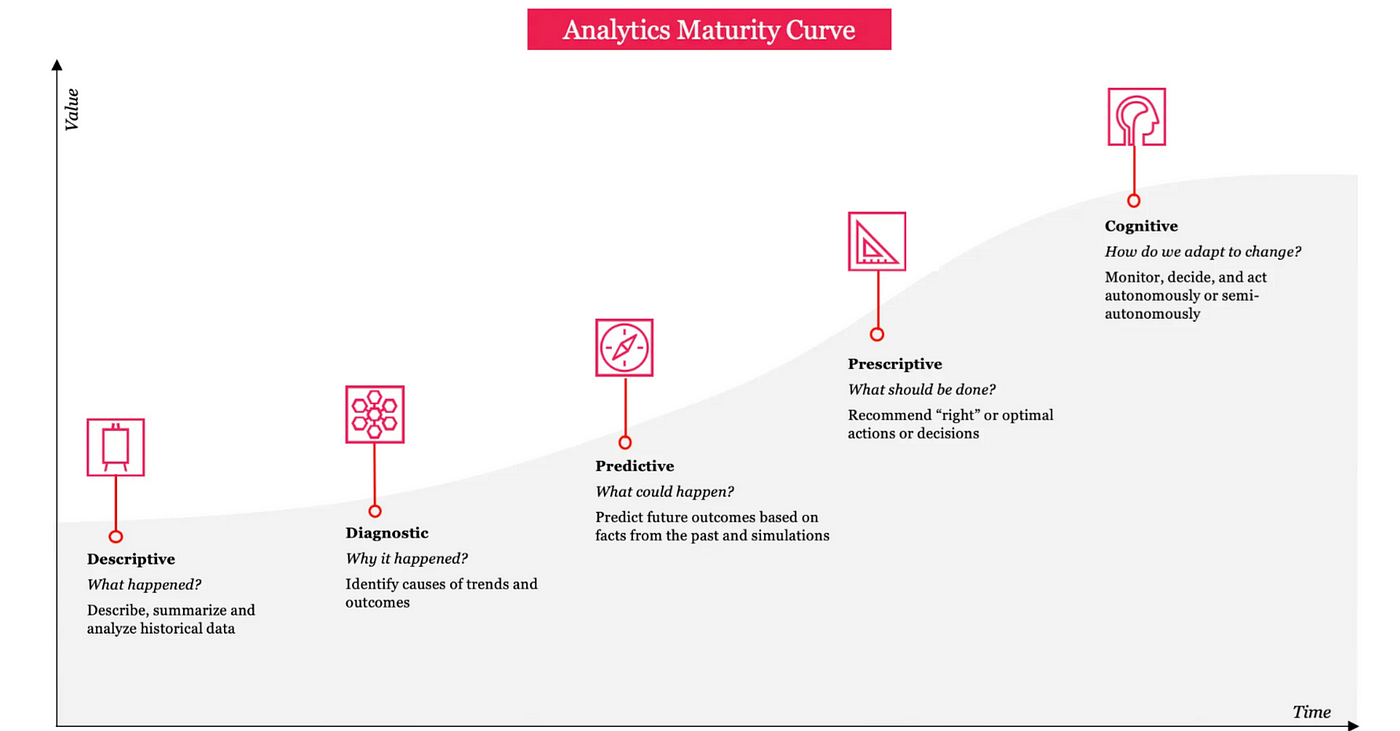
PricewaterhouseCooper, meanwhile, also has a useful version they call the "Analytics Maturity Curve". Here you get a sense for how the value of analytics specifically increases over time, as you collect more data and develop deeper capabilities at interpreting it. We highly recommend reading the linked articles for additional nuggets of data wisdom.
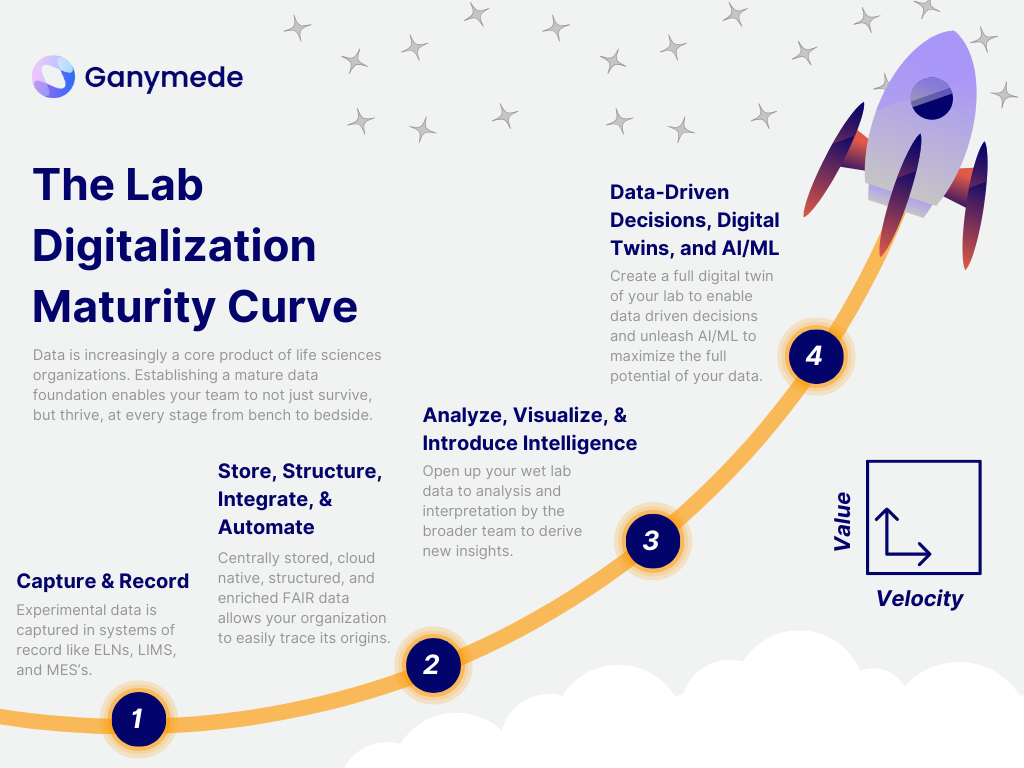
Inspired by both Databricks and PwC, we like to think about wet lab digitalization in terms of maturity, too. The more digitally native your lab is, the more value you can extract from your data, and the faster and more efficiently your organization can operate. We call this the Lab Digitalization Maturity Curve, and see this happening in four stages:
- Capture and Record
- Store, Structure, Integrate, and Automate
- Analyze, Visualize, and Introduce Intelligence
- Data-Driven Decisions, Digital Twins, and AI/ML
Below, we dive deeper into each of these steps on the curve.
STEP ONE. Capture and Record
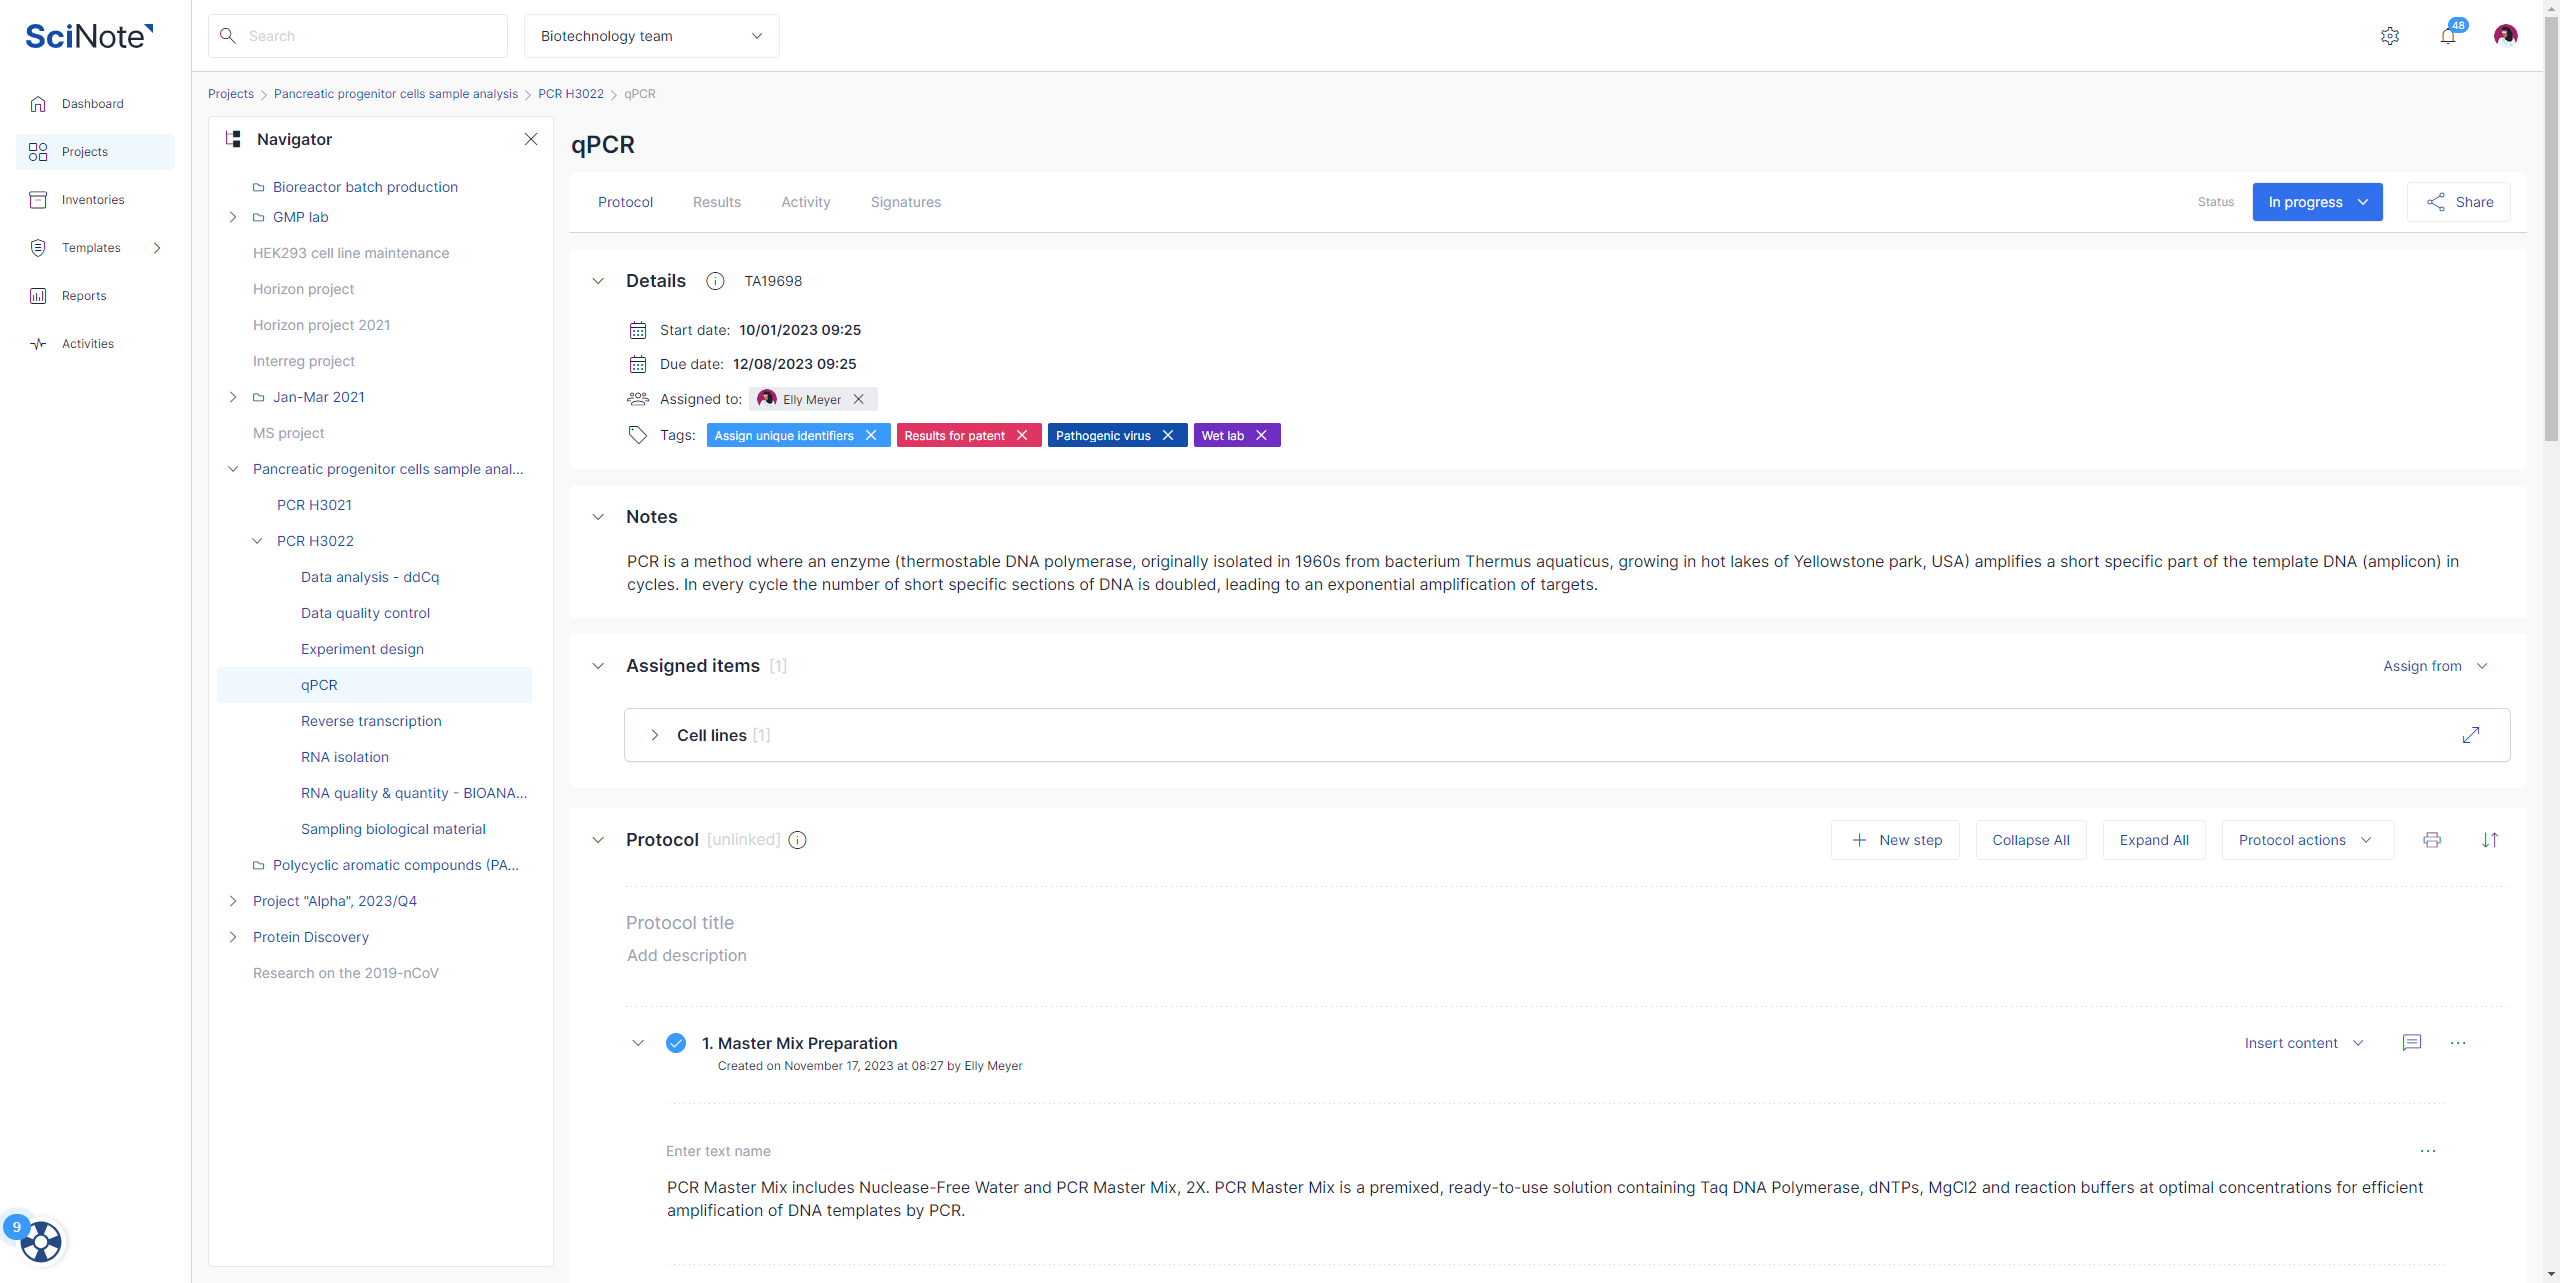
The first step on the wet lab digitalization curve is the most basic: you need to actually capture data in a digital format. That means getting data off of lab machines like flow cytometers and bioreactors and into systems-of-record SaaS tools.
Examples of solutions at this stage include:
- Electronic lab notebooks (ELNs)
- Laboratory information management systems (LIMs)
- Manufacturing execution systems (MESs)
What do all these tools have in common? They are a central point where bench scientists can compile all of their experimental results alongside the protocols used to generate them, and the context for explaining them. With these solutions in place, you're able to address the most basic question: what is happening in my lab?
Now, unfortunately, many labs are still recording results on paper and manually entering data into ELNs, LIMs, MESs, and other software platforms. Scientists spend significant time downloading and porting between instruments and PCs via USB keys and shared drives, or typing information into Excel spreadsheets only to copy/paste it out of them. More importantly, these solutions are only capable of holding a fraction of the total information about your lab operations and scientific programs. So even if you have an ELN or LIMs product in place, there’s lots of room to grow from Step One.
STEP TWO: Store, Structure, Integrate, and Automate
Let’s face it, many organizations will have multiple system-of-record tools, depending on workflow complexity and the stage of drug development they're trying to keep track of (from early R&D to manufacturing). However, to lay the foundation for maturity and future growth though, organizations need more. Which leads us to Step Two.
Every byte of lab data and metadata needs to achieve the FAIR standard—findable, accessible, interoperable, and reusable— to begin to maximize the value of that data. This allows you to fully trace and understand the lineage of your data—or the “how did a given event happen?”—of your workflow, which is several degrees more advanced than just having those analyzed results in your system of record. Critically, having fully FAIR data allows labs to more easily 1) maintain compliance, and 2) diagnose and resolve any bottlenecks or errors.
Practically speaking, the first step towards achieving data FAIR-ness means capturing and storing it in a central location, such as a:
- Generic cloud solution
- Data warehouse
- Data lake
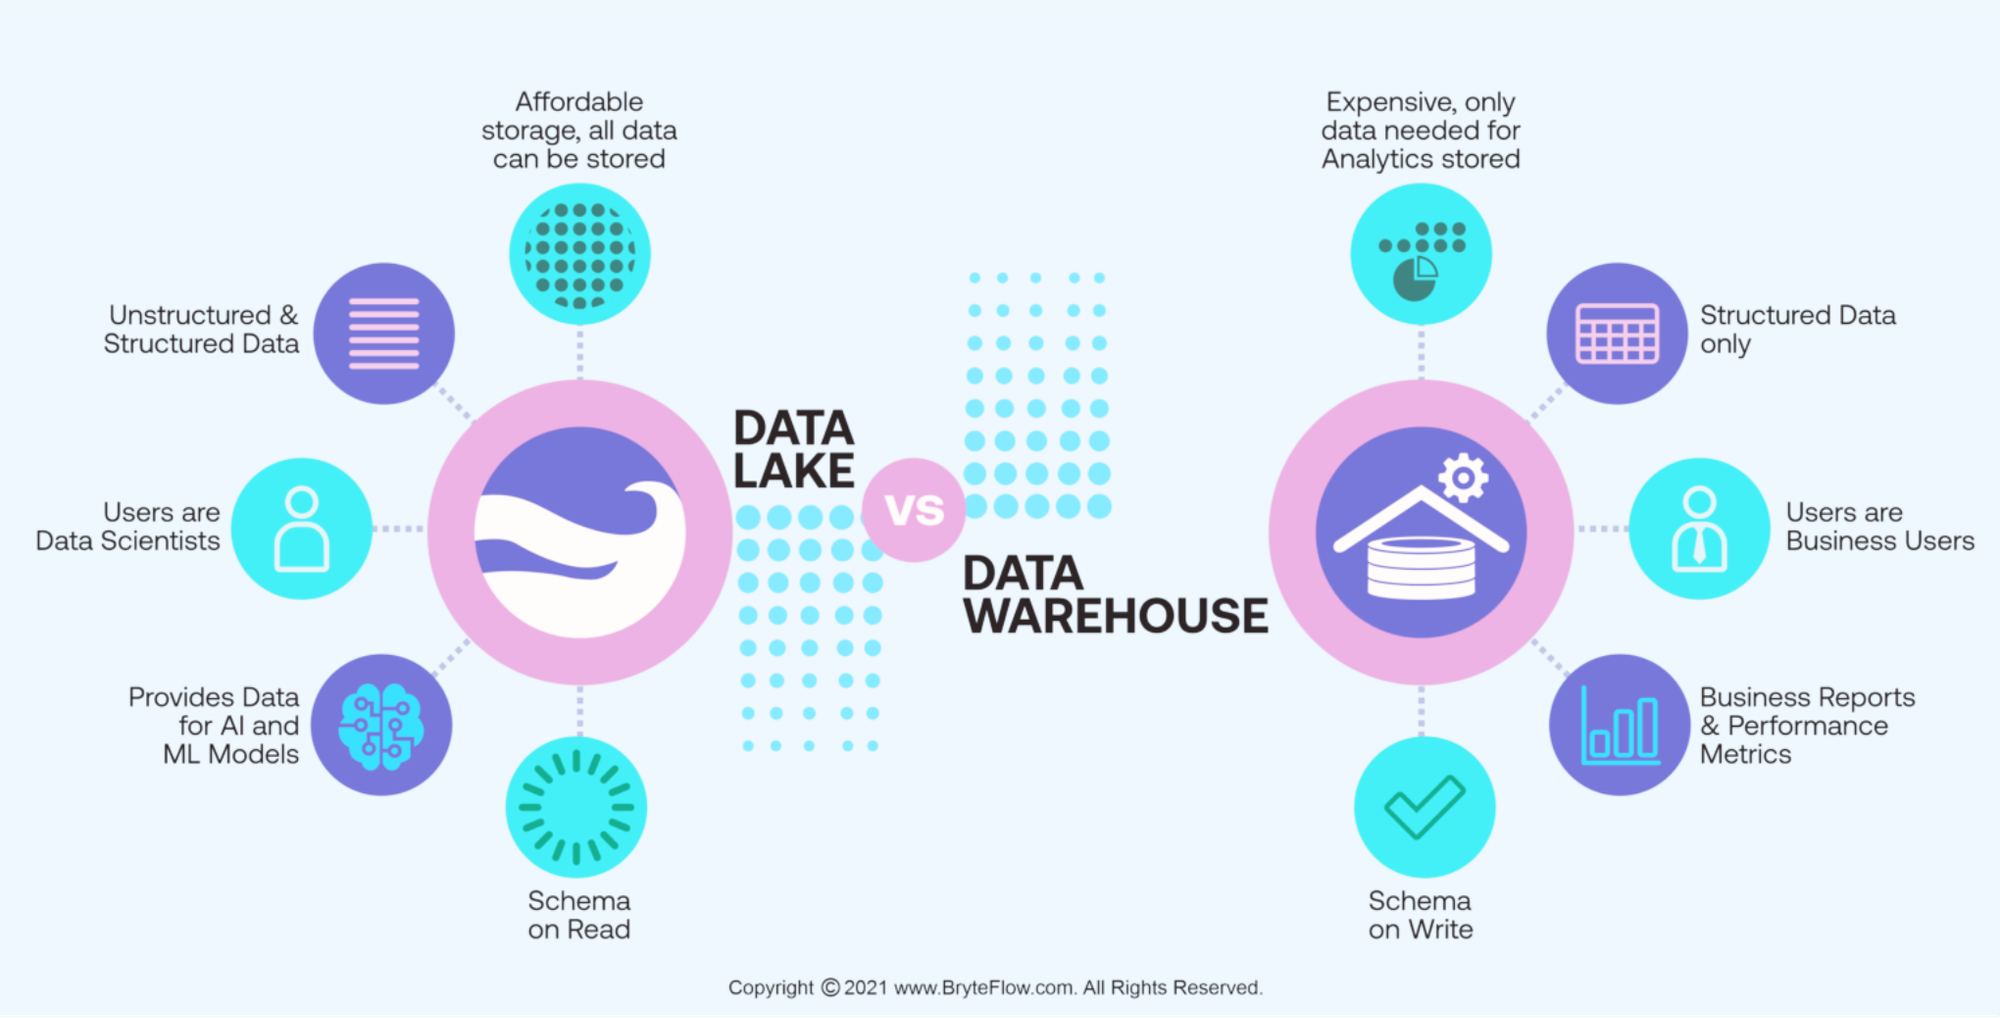
Or ideally, a scientific-data cloud (SDC) like Ganymede’s platform:
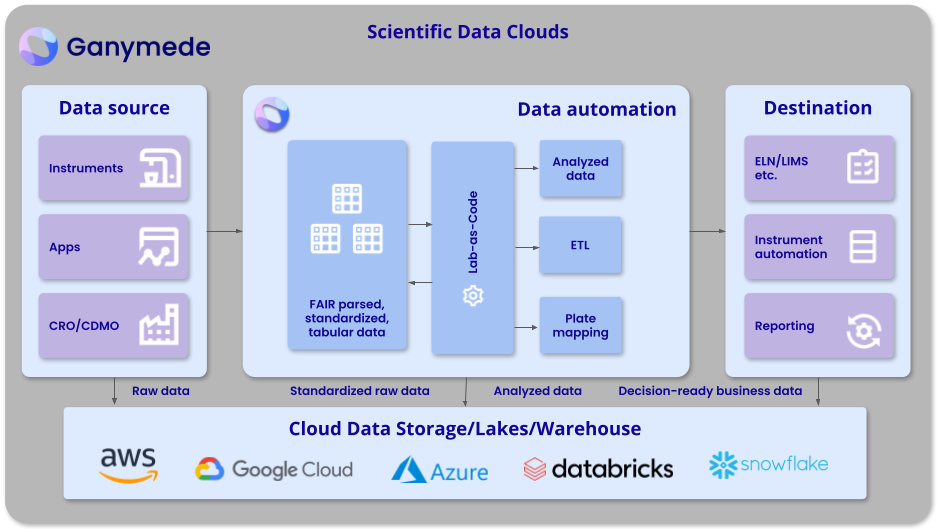
The defining feature of this step of the maturity curve is that your lab data needs to be stored in standardized interoperable formats. This naturally allows you to more easily integrate the data into other solutions and applications. Additionally, it empowers you to open up the data to meaningful interpretation beyond the scientist or team that created it. In other words, a multiplier effect is applied to the value of the data, since the broader organization can begin using it. Otherwise, your data lake can rapidly become a data swamp.
Automation, of course, is an added lever here that can be applied one FAIR data protocols are in place to help tremendously with streamlining data collection, processing, and entry. By handling data automatically, we've found that labs can reduce data entry errors by upwards of 90 percent and save at least 20 percent of scientists’ time. Check out our recent blog post on building a lab automation stack for more insights to bringing automation to your lab.
STEP THREE Analyze, Visualize, and Introduce Intelligence
Already have a warehouse full of FAIR data? Great, you're ready for Step Three: understanding your data AND lab operations.
Combined with well managed, clean, and interoperable data, business intelligence (BI) and visualization software can facilitate more powerful, faster analysis of lab data, as well as enable new insights into operations.
With the right tools at their fingertips, organizations can interpret their lab data in new ways:
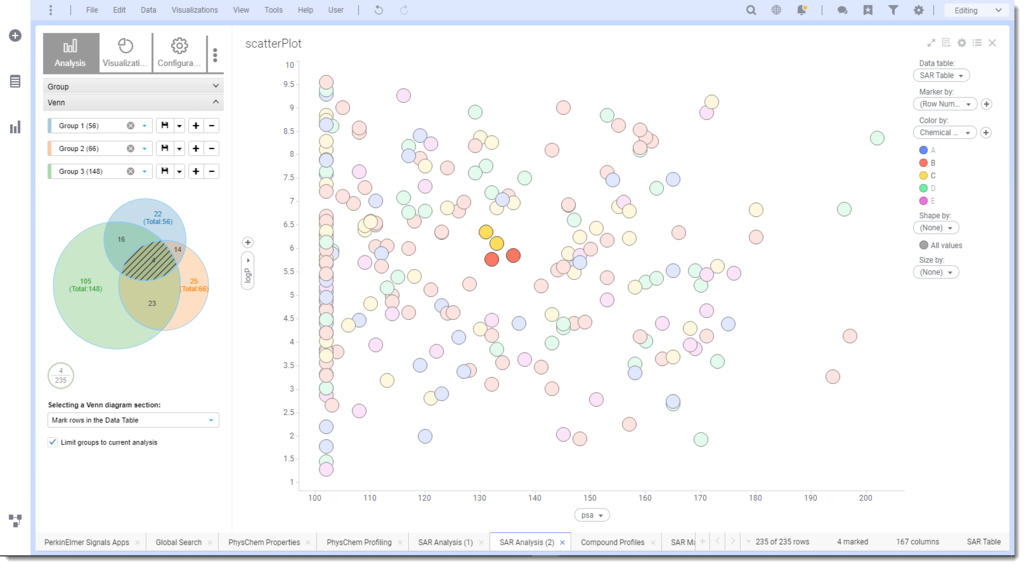
...as well as start to visualize their lab operations too:
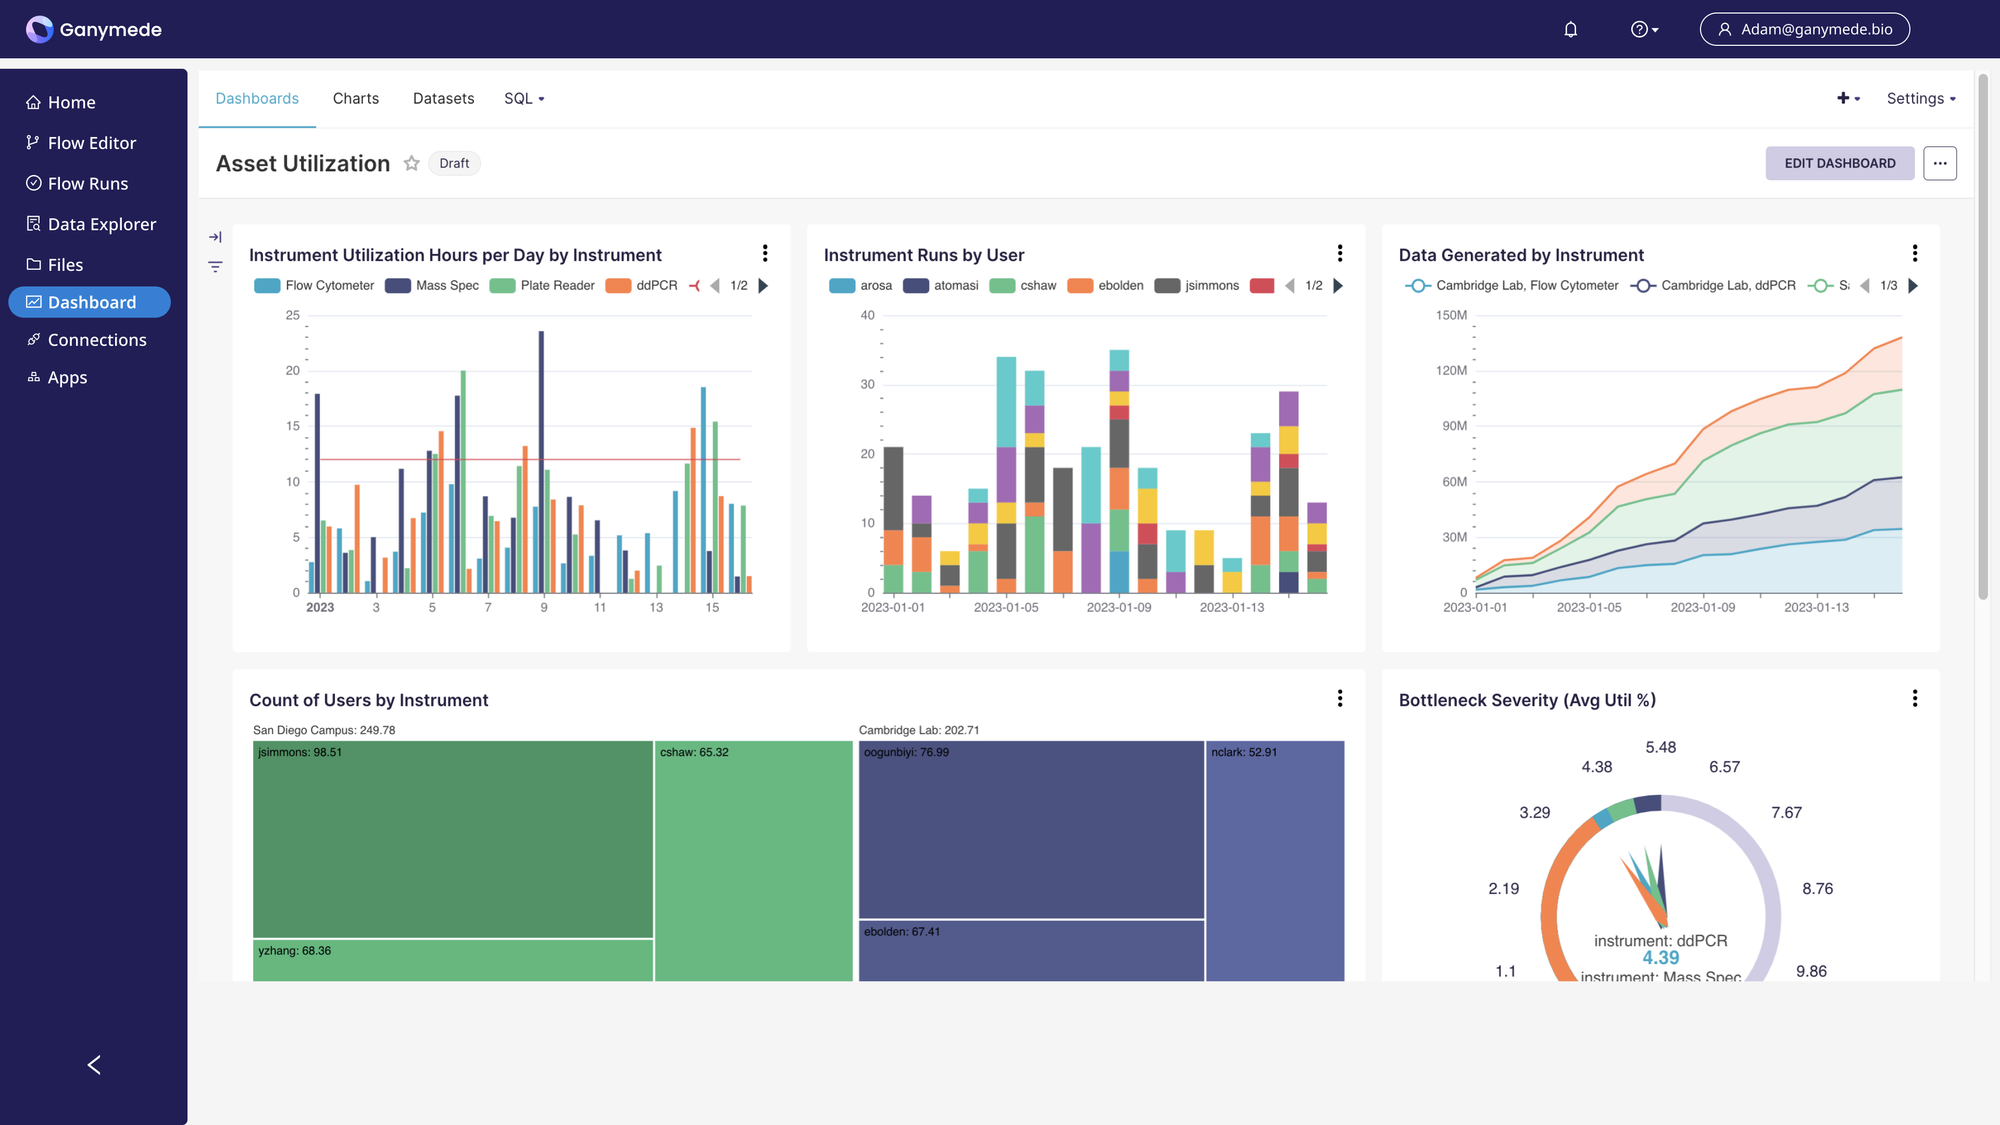
At this step in the Lab Digitalization Maturity Curve, labs are turbocharging the functionality and usefulness of their unified data. They’re able to connect more dots, uncover more insights, share the data with other teams, and put the power of data science in the hands of every bench scientist.
For example, in labs with analysis and business intelligence tools:
- Data scientists can start looking across many experiments, including historical ones, to determine patterns Lab management can look at the metadata of experiments to derive insights into their lab operations (e.g. cell sorter runs by our cell line development team this week, month, quarter, and year to assess capex).
In short:, analysis and BI tools working off of high quality data can empower labs to understand not just what is happening in your R&D and manufacturing programs and how, but why those things are happening.
(Sidenote: if you’re at this step on the curve and use a lot of flow cytometry tools, make sure to check out our recent blog post about analytics tools specifically built for this instrument.)
STEP FOUR: Data-Driven Decisions, Digital Twins, and AI/ML
By this point, you’ve reached the peak of the digitalization maturity curve and can consider yourself a data-centric organization.
When a lab operates with a data-first approach, they’re able to cast off many limitations and take advantage of the latest, most advanced tools. Decision-making can now actually be driven by the latest data and insights. AI and machine learning (ML) can be successfully applied to solve a wide variety of (specific) problems by working off of rich data sets.
For very digitally mature labs, this step is also when it’s time to flip from thinking about digital twins—creating a digital replica of your physical lab—to thinking about physical twins—starting with the digital footprint and data flows first and then building your physical lab to meet those needs (more on that here). For example, rather than designing an experiment in physical terms and then forcing the data into digital systems as an afterthought, digital data collection and management becomes one of the first things to think about when designing a new experiment.
Most labs today simply do not operate this way. Data management is tacked onto the physical lab space and experimental design. Scientists design and run an experiment, and only afterwards do they think of what to do with that data. With modern scientific data clouds, labs finally have the right tools to improve on the status quo, where data pain and analytical limitations are a daily reality, and become digitally mature.
How a digitally-mature, data-first organization operates (well at least in theory).
Start Today: Bring Lab Digitalization Maturity to your Company
Bringing digitalization to the wet lab is a journey. It may seem intimidating or confusing, full of advanced software and niche data management practices. And of course life science data is complex, requiring multiple machines and chock full of variables.
However, lab digitalization is well worth the effort. It empowers you to:
- Ensure the first-to-market advantage for your therapeutics with a data-first mindset
- Streamline and optimize existing lab operations
- Plan your growth "intelligently"
Data is increasingly a core product of life sciences organizations. Establishing a mature data foundation enables your team to not just survive, but thrive, at every stage from bench to bedside.
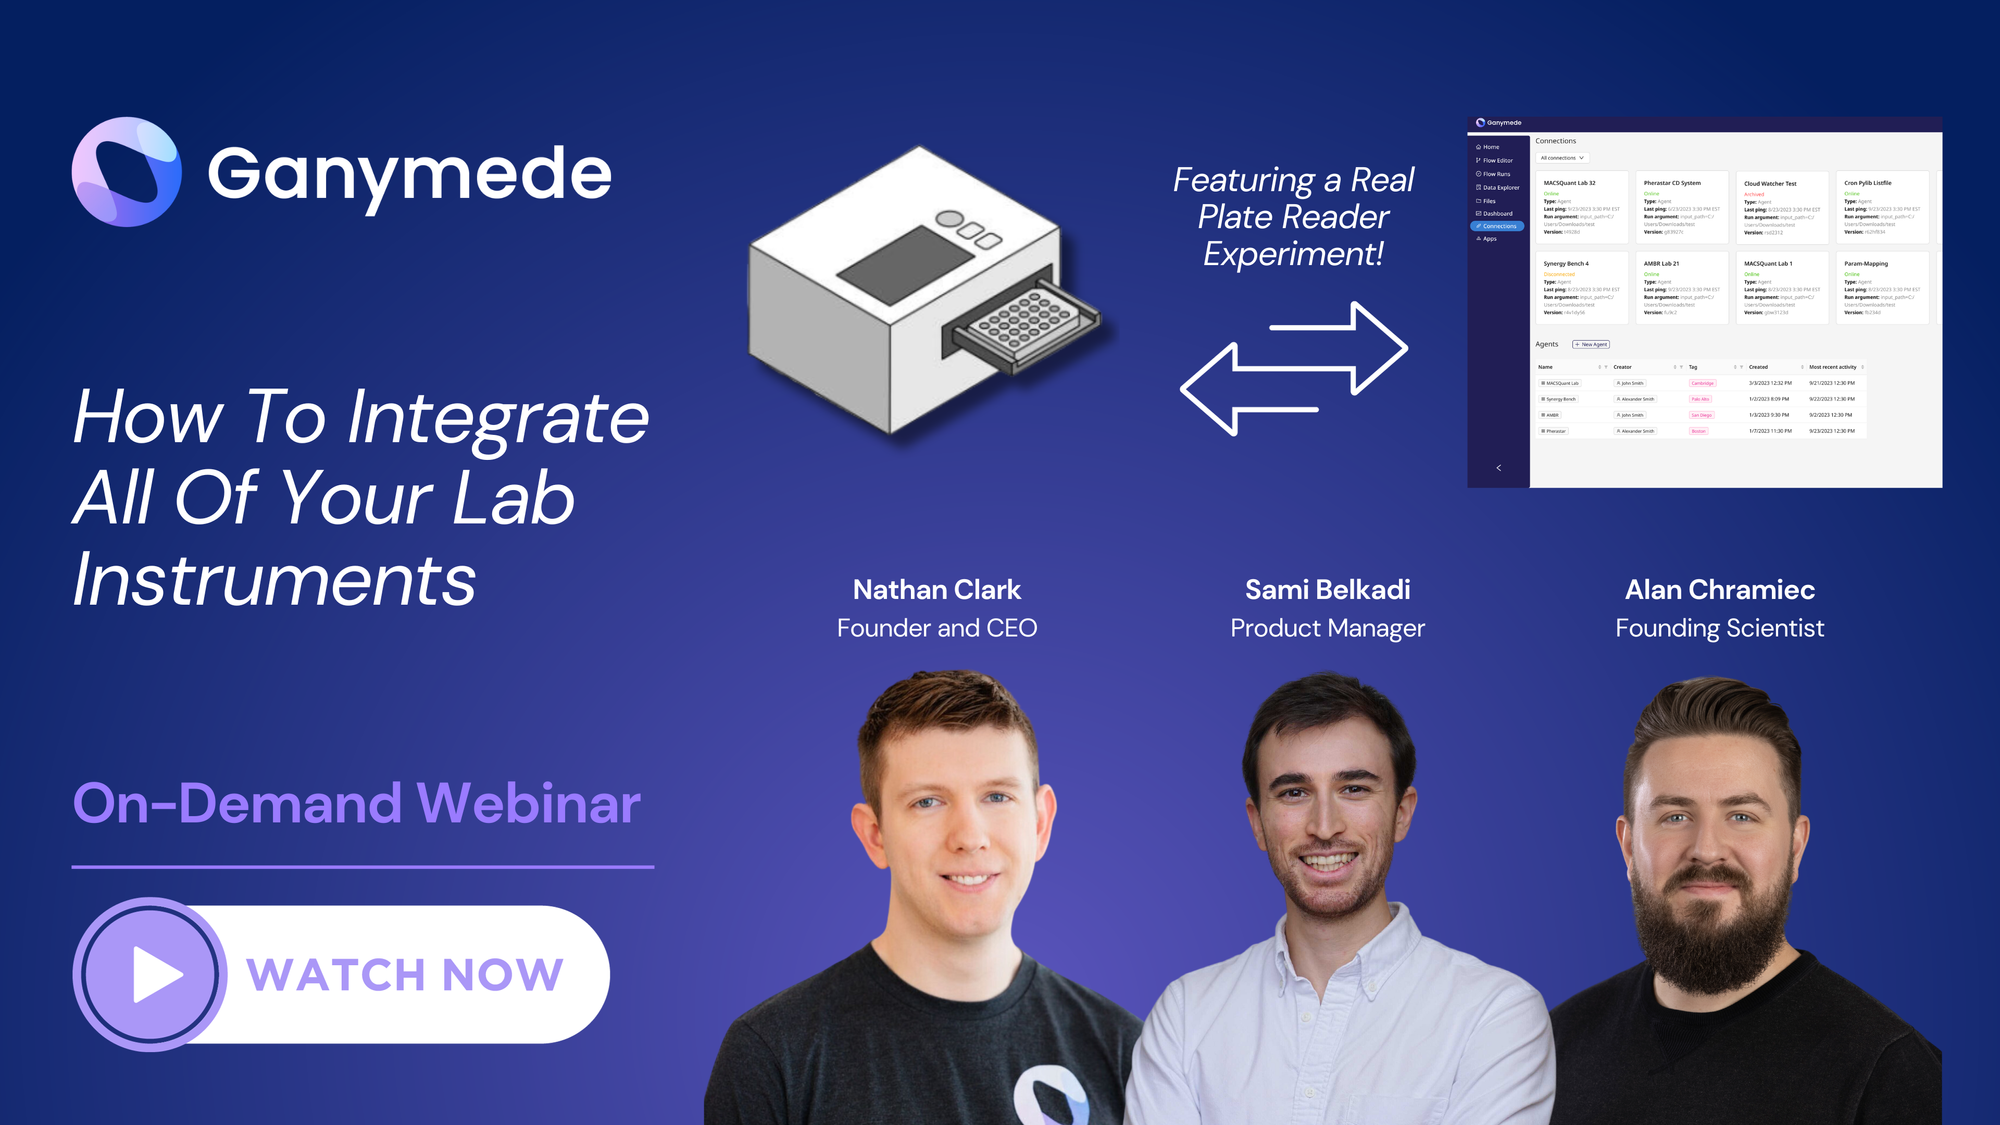
Learn how we can empower you to bring FAIR-ness to your lab data in our latest webinar on digitalization, now available on-demand: