7 tools to take your flow cytometry data visualizations to the next level
Because your flow cytometry analysis should be as colorful as your stained cells.

Flow cytometers—they’re a workhorse instrument in any lab working with cells. Almost every biologist has fond (or not so fond) memories of sitting in front of a flow cytometer, loading tube after tube, and watching those cells and events pile up until the next sample.
From small, early-stage R&D all the way through clinical trials, flow cytometers are a crucial part of discovering, developing, and producing most new therapeutics. This is especially true in the cell and gene therapy space. Because these instruments are so central to how labs conduct research, they generate a substantial amount of valuable data.
The challenge is that flow cytometry data, despite coming off the instrument in a standardized format (literally called the “flow cytometry standard” or FCS), is highly specialized and complex, with critically important metadata as an added layer of difficulty. This means—as we’ve written about before in a post about lab automation—that analysis is the biggest challenge when dealing with flow cytometry data. In fact, analysis is often the most complicated part of dealing with all instrument data at a biotech, according to Scaling Biotech.
Unsurprisingly, common data visualization tools are not effective for raw flow cytometry data analysis. The initial stage of flow analysis typically involves complex processing via gating strategies, annotation, and statistics generation. It’s the stage at which scientists are most dependent on visualization for understanding their experimental results. Popular tools like JMP or GraphPad Prism fall short, as they’re better suited for more customized, downstream, and second order analysis of processed results, typically across several experiments (i.e. charts and graphs).
But there’s good news: As the “software for science” space has continued to grow, there are now many more tools that work beautifully with flow cytometry data. Since Ganymede’s platform is hugely flexible and can integrate data from any source—including any application—we’ve come across a variety of solutions that cater specifically to this crucial instrument category.
Below, we explore seven different tools to help scientists take their flow cytometry data visualizations to the next level. Some of these options are familiar, proprietary products, while others are open source tools you’ve likely never encountered before. Either way, any of these tools can help your lab gather, analyze, and visualize your data without sacrificing the context needed to truly understand it. (And they all integrate with our new Virtualization feature, too!) We also discuss some of the emerging trends tied to some of these solutions, such as automated gating.

Proprietary Tools
Proprietary tools are the most widely used solutions for flow cytometry analysis, and for good reason. They offer a more robust and intuitive user experience (UX), a lower bar to entry, and substantially more documentation and support. Whatever problem you’re having with these solutions, there’s almost always a Youtube video for fixing it. On top of that, several of these tools also offer broader platform services, such as analytical solutions, artificial intelligence (AI) and machine learning (ML) features, cloud storage, and more.
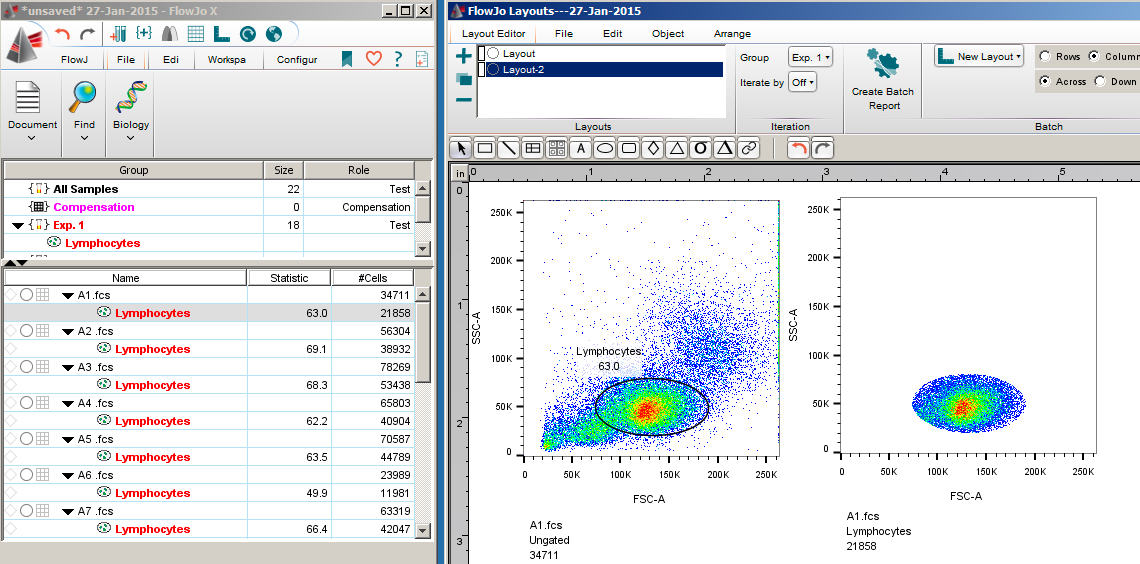
1. FlowJo: FlowJo has become near synonymous with flow cytometry, and it defines the field. It’s by far the most widely used tool on our list, combining a user-friendly interface with advanced data analysis and visualization capabilities to dissect and see all your cell populations. FlowJo also boasts a substantial user community ready to support any of your troubleshooting efforts. For users of the BD Research Cloud, this tool is a no-brainer to invest in, too. That said, FlowJo is not without its weaknesses. The licensing costs can be relatively high, there’s a learning curve for new users given the depth of features, lag times with large datasets are not uncommon, and only recently has the solution taken a more innovative approach towards integration with broader software platforms.

2. FCS Express: Building off the familiarity of PowerPoint and Excel, FCS Express is an excellent choice for beginners to flow cytometry analysis. Its spreadsheet-based approach will appeal to anyone who likes using Microsoft Office Suite of products. The primary appeal of this solution is how quickly and easily you’re able to generate presentation-ready visual results. However, this ease of use is a double-edged sword;- FCS Express excels only at basic analysis and lacks some of the advanced features of other solutions. We’ve also found the results files aren’t standardized enough to enable robust integration with downstream applications like electronic lab notebooks (ELNs).
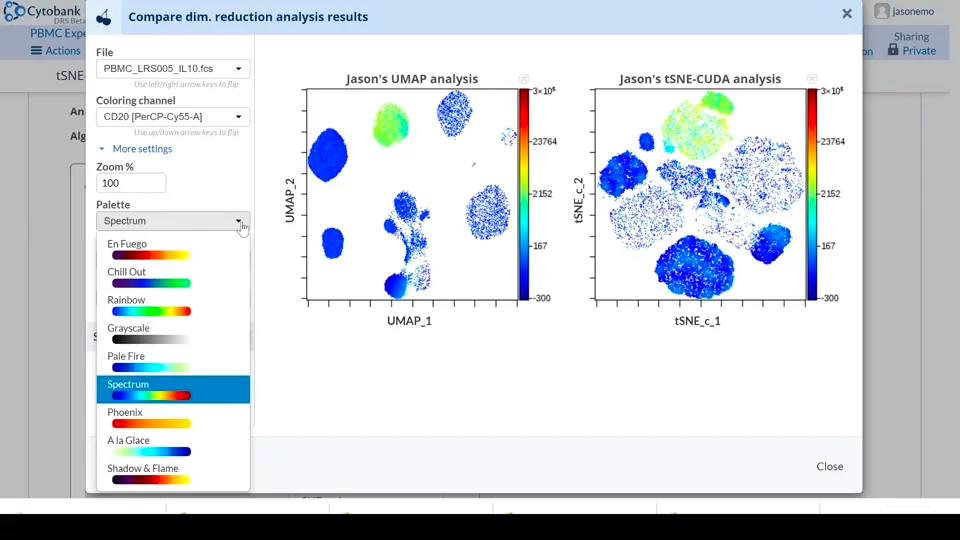
3. Kaluza / Cytobank: Have a lot of Beckman Coulter flow machines? Then Kaluza might be the best option for you. It offers seamless compatibility with their instruments and more efficient workflows for analyzing large data sets. Cytobank is the other offering from Beckman Coulter, and has a broader scope than Kaluza. Taking a platform approach, Cytobank brings together a more robust suite of capabilities beyond visualization, including ML support for analysis, experiment tracking, more regular updates and improvements, and more. As with FlowJo, the main downsides involve costs and getting set up.

4. SpectroFlo: If you’re in need of a truly multicolor flow cytometry experience, Cytek’s SpectroFlo might be right for you. Spectral flow cytometry is an emerging approach, as it allows for high-dimensional investigation of many more cellular parameters—in some cases up to 40 different colors in a single experiment. These complex datasets require equally advanced software, and Cytek is working to meet biotech’s needs with this relatively new solution. SpectroFlow offers high compatibility with Cytek’s suite of flow instruments, in the same vein as Kaluza/Cytobank does with Beckman Coulter’s. It’s easy to can analyze data across many parameters simultaneously, perform real-time analysis for optimizing runs, and automated compensation and batch processing.
While these proprietary systems by definition incur costs via licenses and seats, they also offer a more formal, productized approach to flow cytometry data. For labs looking for something with more bells and whistles or to deploy on a larger level, some of the options above may be the most appealing.
Open Source Tools
Open source tools are a favorite in many different industries for many reasons, chief among them innovation, flexibility, and cost. In the life sciences, open source tools emerge from the same place as most novel approaches often do: academia. It’s often quick and easy to get started with an open source tool, and time is of the essence when it comes to making discoveries.

5. FlowKit: For those interested in continuing manual analysis and being able to layer on automation, this might be the solution for you. FlowKit is a GatingML 2.0 standard compliant, Python-based toolkit that integrates both FlowJo workspace file data and new libraries of Single Cell Data Science algorithms. These features make it a great tool for testing out advanced secondary analysis approaches. The major downside? You need to have some coding experience to run the kit off of Git.

6. Floreada: Another open source tool. Floreada prides itself on being a visualization tool for everyone. The tool is web-based and doesn't require coding expertise, so it’s a good choice for non-developer scientists.

7. Cytoflow: A favorite here at Ganymede, Cytoflow can opens your eyes to a new way of visualizing flow data. This tool makes your job easy with a user-friendly interface, easy-to-export graphics. It can process large data sets quickly and maintain lots of metadata documentation. Cytoflow was created specifically to integrate with Jupyter Notebooks, too. Where this solution really differentiates from other tools is its focus on metadata and analysis as a workflow to analyze the internal state of cells, rather than population analysis associated with tools like FlowJo. For example, Cytoflow is ideal if you’re assessing the distribution of certain fluorescence markers across samples, as in a standard dose response experiment. Unfortunately, Cytoflow does require direct knowledge of Python and code to get more out of the tool than what’s already built-in—so if you’re more of a no-code person than a low-code person, you may want to try a different option.
There’s an inverted bell curve distribution when it comes to user expertise with flow cytometry analysis (and user budget), and appetite for open source tools. For labs just starting out with visualization tools for flow cytometry or for labs seeking low-cost (read: free) options, the options listed above offer a fast, affordable way to start making sense of data. For advanced flow cytometry users that want something more than the proprietary solutions—and who want to push the boundaries of what’s possible—open source tools are often the only way to access the most cutting edge approaches to flow visualization and analysis.
Going with the Flow
Flow cytometry data holds powerful insights into experimental runs, possible discoveries, and potential therapeutics. It’s complex—and valuable. Being able to understand that data, represent it to other stakeholders in your organization, and advance your science is crucial. And being able to do all that easily—and beautifully—is the dream of many scientists.
Thankfully, there’s constant innovation happening in flow cytometry, and so labs today have many great options to choose from. All you need to do now is run your own multi-parameter analysis to determine which tool best fits your experimental complexity, data volumes, user experience, budget, and of course, compatibility with your hardware and software.
If you'd like to see what these flow cytometry tools looks like in Ganymede, make sure to check out our latest interactive demo.