
Three Key Metrics to Improve Your Lab Asset Utilization and Lab Automation
One of the most common points of failure in lab data automation is deceptively simple: things stop working, and labs don’t know why.
While one or two failures may be fixable by hand, once a lab has scaled up to dozens of workcells or hundreds of analytical instruments, that lack of insight becomes a major problem. Breakdowns can occur anywhere across various instruments and vendors, leading to islands of isolated, difficult-to-understand data and slowdowns in scientific discovery.
Without a line of sight into how assets are performing, labs cannot unstop bottlenecks, prioritize spending, or optimize workcells.
In this post, we’re exploring three key metrics labs should track in order to improve lab asset utilization. Each of these metrics can help your lab better understand how instruments are performing, where (and why) breakdowns occur, and plan for the future.
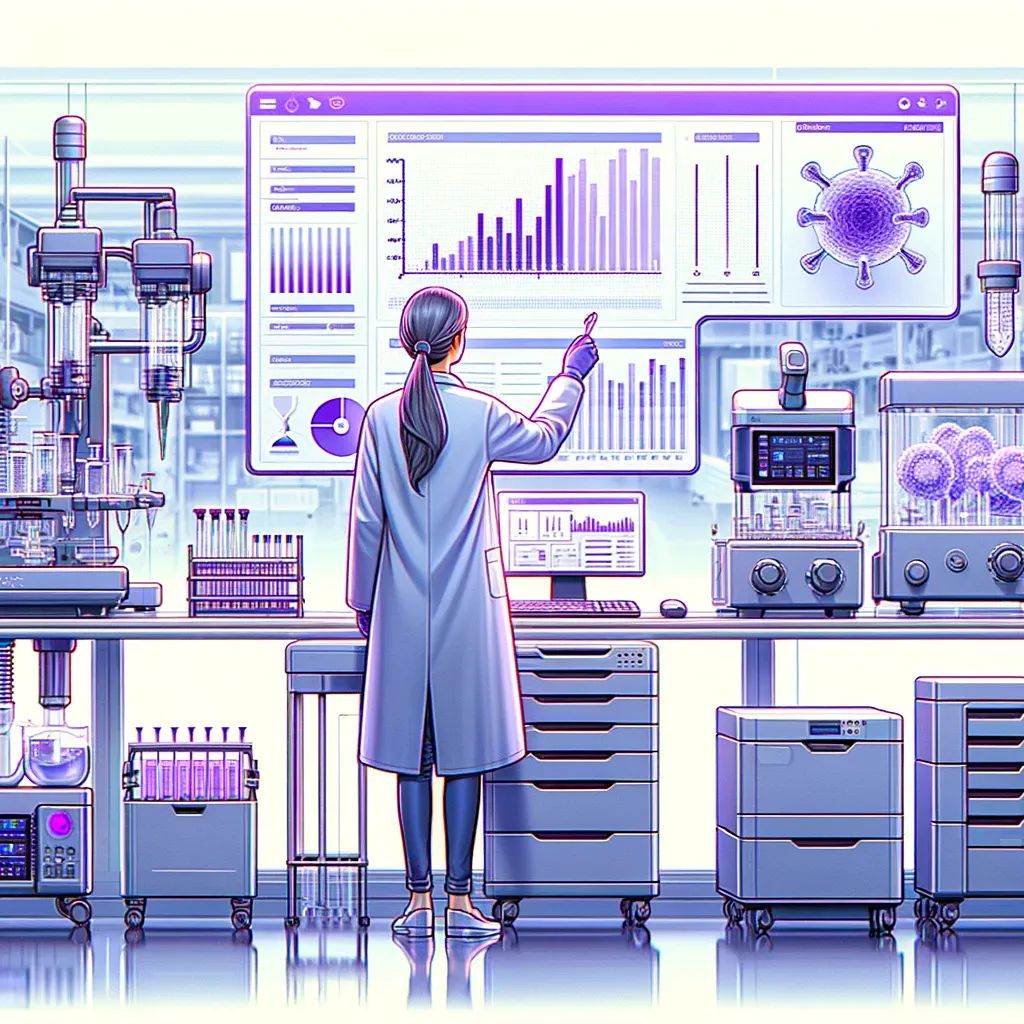
1. Instrument Capacity
Every lab will have workhorse pieces of equipment and less popular pieces of equipment. Regardless of how often each instrument is used, it’s important to understand how scientists interact with assets over time.
By collecting data on utilization, labs can answer important questions such as:
- How much downtime is each piece of equipment and/or workcell experiencing?
- How and when are they failing?
- Who uses each piece of equipment—and how often?
- Which lab instrument and/or workcell is used across multiple experiments?
All of these questions can help improve decision making around where labs expand, decrease, or otherwise change their lab automation investments.
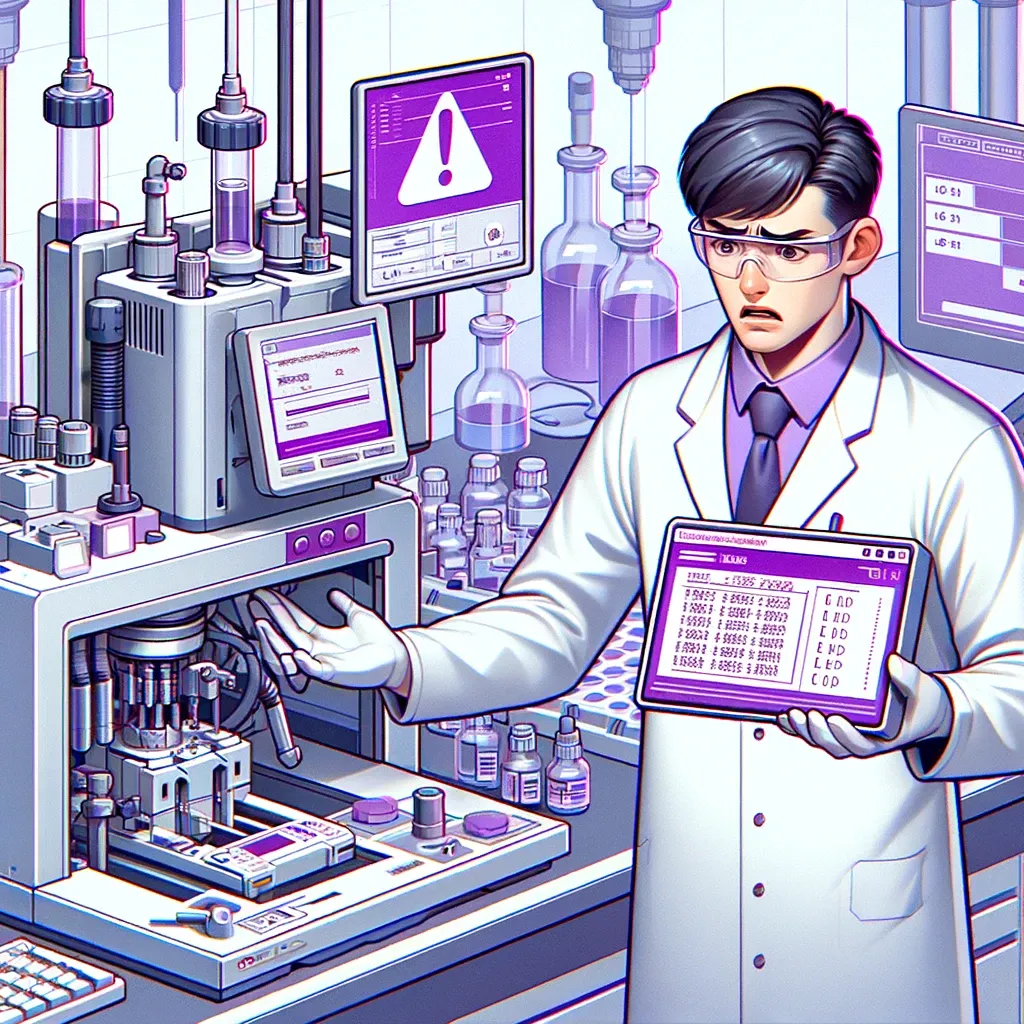
2. Error Groupings
While some errors are just one-off flukes, many times an error in lab automation falls into a common category.
For example, automation workflows can break down when:
- Initialization fails
- There’s a problem reading a barcode
- A sequence is blocked
- The system returns an impossible aliquot
- Network resets or software updates interrupt experiments
- There is crossover between daytime and nighttime runs
Oftentimes, when there are repeated errors in a specific category, there is a physical problem (such as barcodes on equipment) or a recurring digital error (such as a coding problem in a data pipeline).
When labs track common causes of errors, it becomes much easier to address systemic problems on a general level. For example, perhaps a different sized barcode or a quick one-liner code change would stop dozens of false experiment starts.
Even better, by understanding common causes of failures, labs can do more predictive maintenance to prevent errors from happening in the first place.
3. Cost of Assays and Instruments
Even the most well-funded biotech organizations need to keep an eye on the bottom line for each product line or experimental candidate. Assays can be a big cost center, and everyone knows just how expensive new lab instruments can be.
Understanding how much money flows to which assays and which instruments is a key part of creating efficiencies and planning for the future. By aggregating data and seeing what assets are being used the most—or the least—labs can make informed decisions about capital expenditures or contracts.
For example, with a good understanding of how much money is spent on assays and instruments, labs can:
- Decide where to add additional instruments
- Figure out how to do more with underutilized instruments
- Negotiate contracts with providers of different materials for assays
- Budget for replacing instruments
- Scale up workcells
- And more
With the ability to “see” into lab instruments and assays, labs can better manage costs, plan for the future, and improve ROI on big instrument purchases.
Better Lab Asset Utilization and Lab Automation Leads to AI Readiness
Scientific discoveries only move at the speed of the slowest experiment. In today’s competitive biotech landscape, labs can’t afford to be slow—and so lab instruments need to work harder and smarter than ever before.
By getting a better lens in lab instrument utilization, life science organizations can work harder and smarter, too. When it’s clear how each workcell and instrument is performing, where problems are occurring, and why, labs can reduce downtime and enable their systems to run 24/7 at greater efficiency.
This unlocks the ability to save hours every month within each workcell, increase throughput, and plan better for capital expenditures.
Even better, understanding your lab asset utilization lays a strong foundation for future AI/ML investments. By learning about and modeling the entire lab’s operations—and the data those activities generate—organizations will be better prepared to adopt advanced algorithms or even true AI. (Check out our recent eBook for more on the unique challenges of wet lab data and AI, as well as strategies to overcome those issues!)
Automation is the future of science, but labs can only understand what they can “see.” So get started with optimizing your lab’s valuable assets today, and start tracking these key metrics.
Manage Your Scientific Data Smarter