
Instrument Reliability and Monitoring: Ganymede's Approach
How often are your analytical instruments used? How often have you wished that you could figure out the sequence of errors that cause your automation runs to fail? How does freezer sample storage temperature affect your assays?
All these questions come down to data. You’ve scaled to dozens or hundreds of instruments, but can't attribute failure reasons, or can't prove that that one HPLC is a bottleneck. Processing needs keep increasing even as your headcount and capital budgets are static. What you’re suffering from is a lack of central visibility into your instruments’ performance metrics and how that ties to business concepts like samples, batches, teams, or inventory. Your islands of automation are turning into an un-navigable archipelago across numerous different vendors and log formats.
Ganymede's solution
Asset Utilization and Reliability Analytics (Aura)
Ganymede’s Lab-as-Code technology powers Aura (short for Asset Utilization and Reliability Analytics), driving the significant data integration and standardization required. Ultimately, whether you use Ganymede or not, solving this problem comes down to data visibility and joining across numerous disparate datasets. If you compile it, data already present in your lab can help you understand:
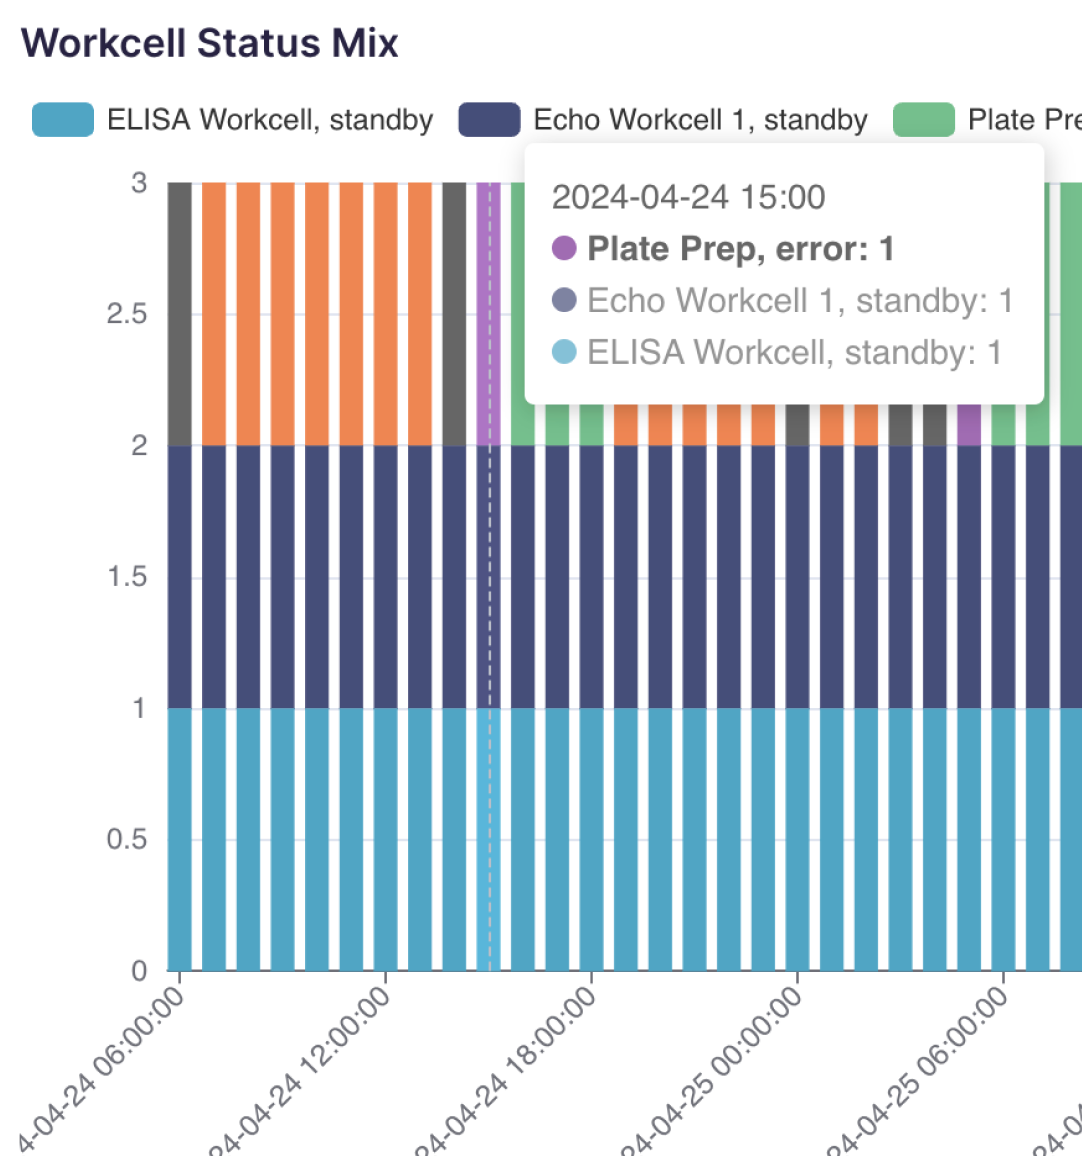
- Instrument status: what state are workcells, analytical instruments, or automation systems in over time? How and when are they failing?
- Cost and planning: how expensive are my instruments? Where do I need to invest? How expensive are my assays?
- Production efficiency: how efficient are my instruments? How can I optimize turnaround time or throughput?
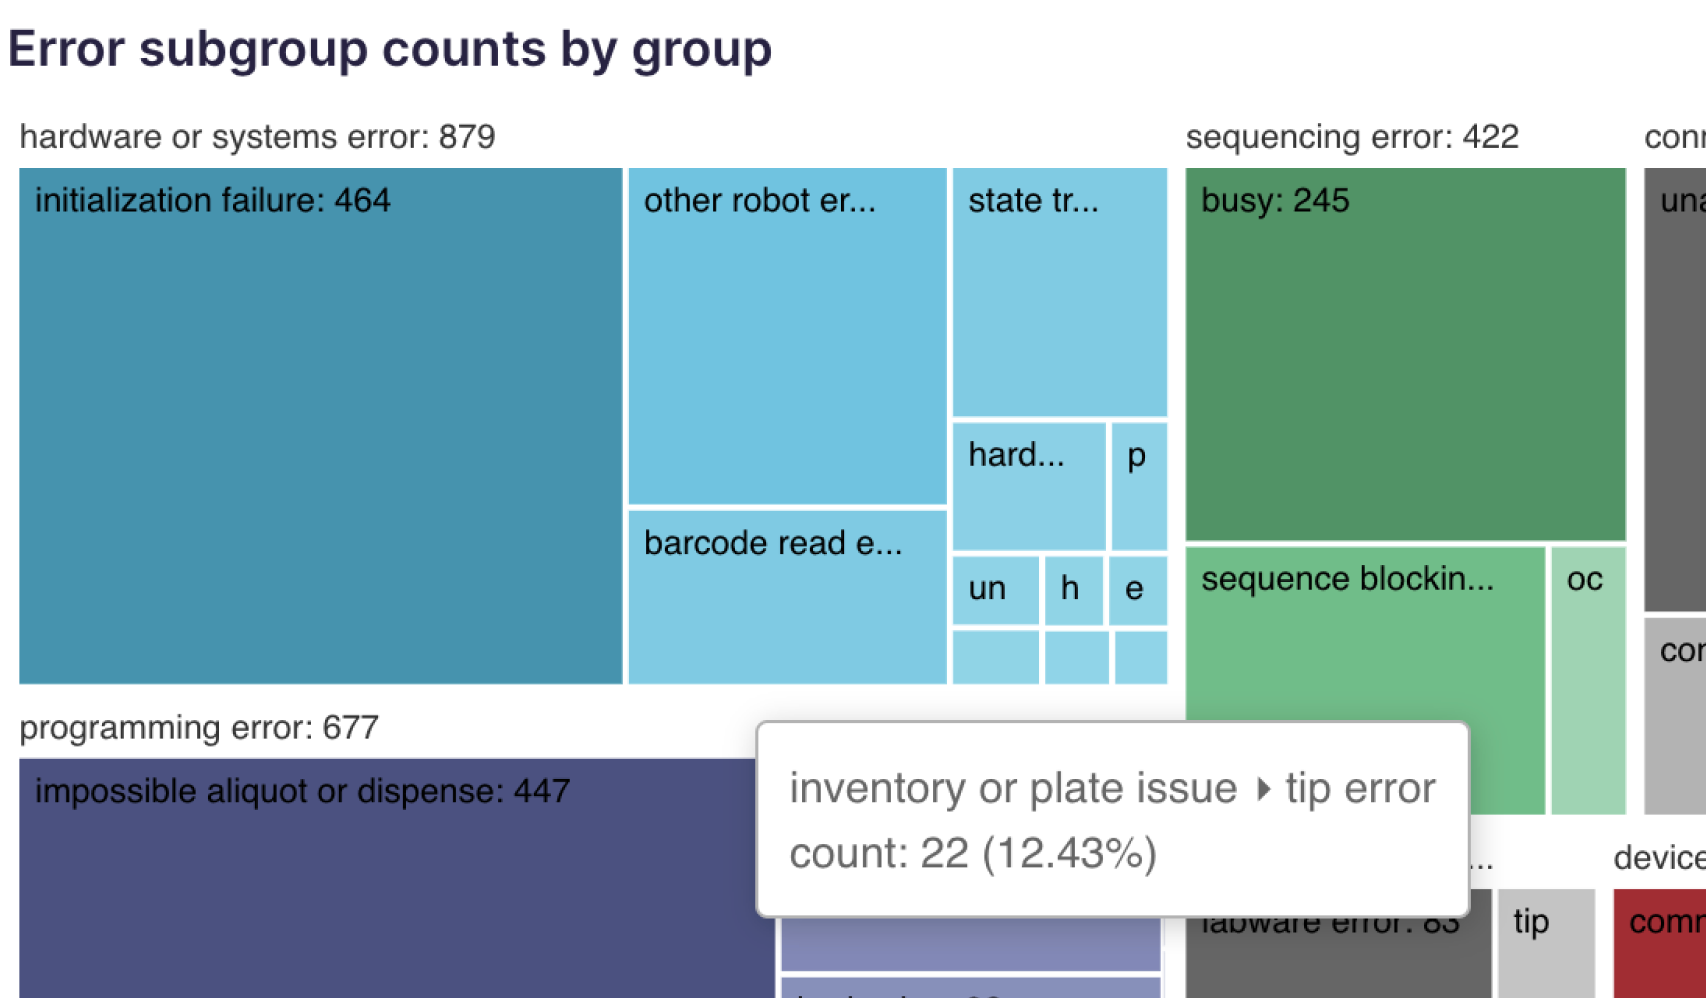
- Error diagnostics: what are the errors or issues my instruments are having? How can I mitigate them? What causes them?
Improving Data Visibility
Aura's core data model tracks instrument status and events across your lab, allowing not just breaking down issues, but also tracing the sequence of errors backwards to find the "true" reason that instruments are failing.
Enabling stability
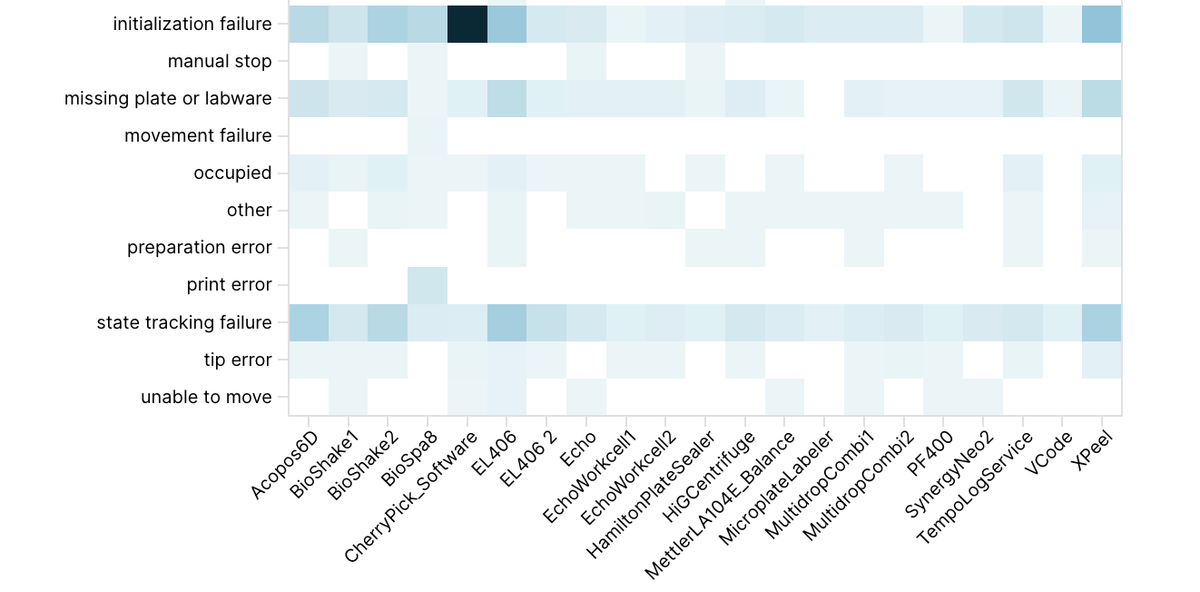
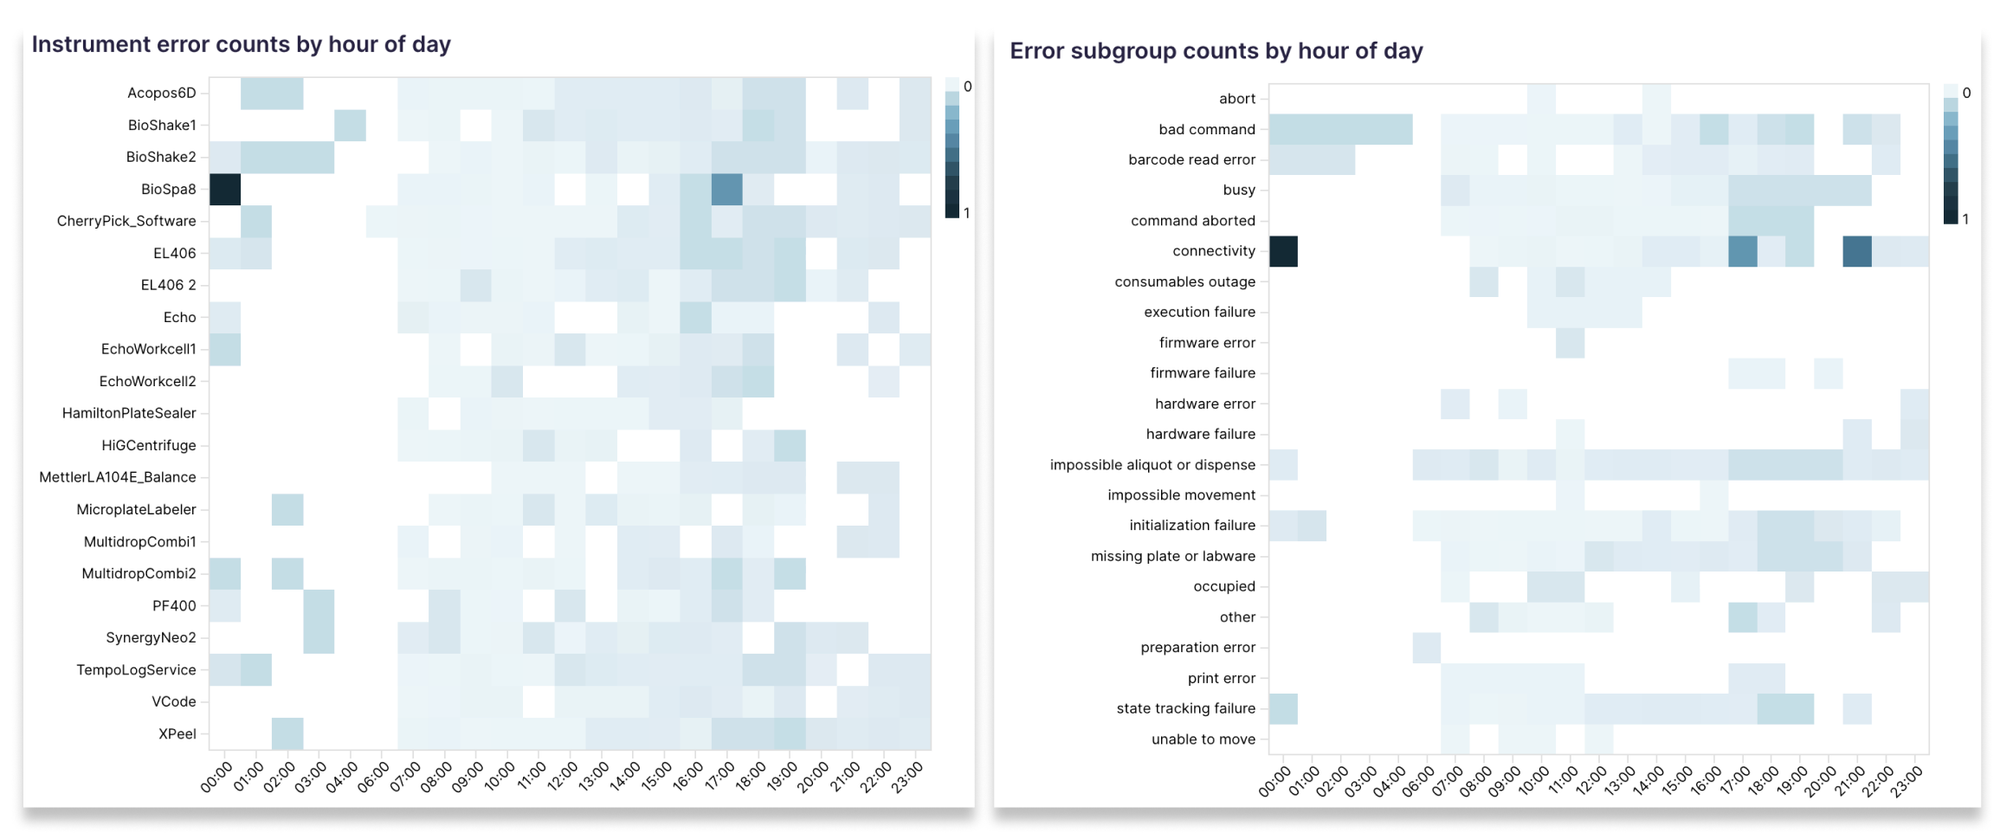
A common investigation explores error frequency across error or instrument types versus time of day, allowing us to see issues like the plate labeler likely going offline at midnight due to a network reset, or the plate hotel bottlenecking at 5pm when overnight runs start. This is a great illustration of this being a data product: it's a pretty easy exercise to visualize this once you have a clean dataset of instruments and error categories by time.
In Aura’s core data model, all instrument events and statuses are logged in normalized tables, which then allow downstream analysis tables and dashboards to be quickly created.
Driving Value
Ganymede can help automation engineers quickly identify issues and plan for fixes, greatly reducing downtime and allowing systems to run overnight. This can:
- Save hours per workcell per month in gathering data, analyzing it, and manually diagnosing problems that Aura can find statistically
- Increase overall throughput and get more from your instruments without having to buy new ones, saving hundreds of thousands of dollars in capex
- Build a rich data foundation for true AI/machine learning modeling of overall lab operations
Interested to learn more?
Reach out to us to Request a Demo Today!