Automating beyond the bench - How to streamline the 5 most common analytical lab instruments.

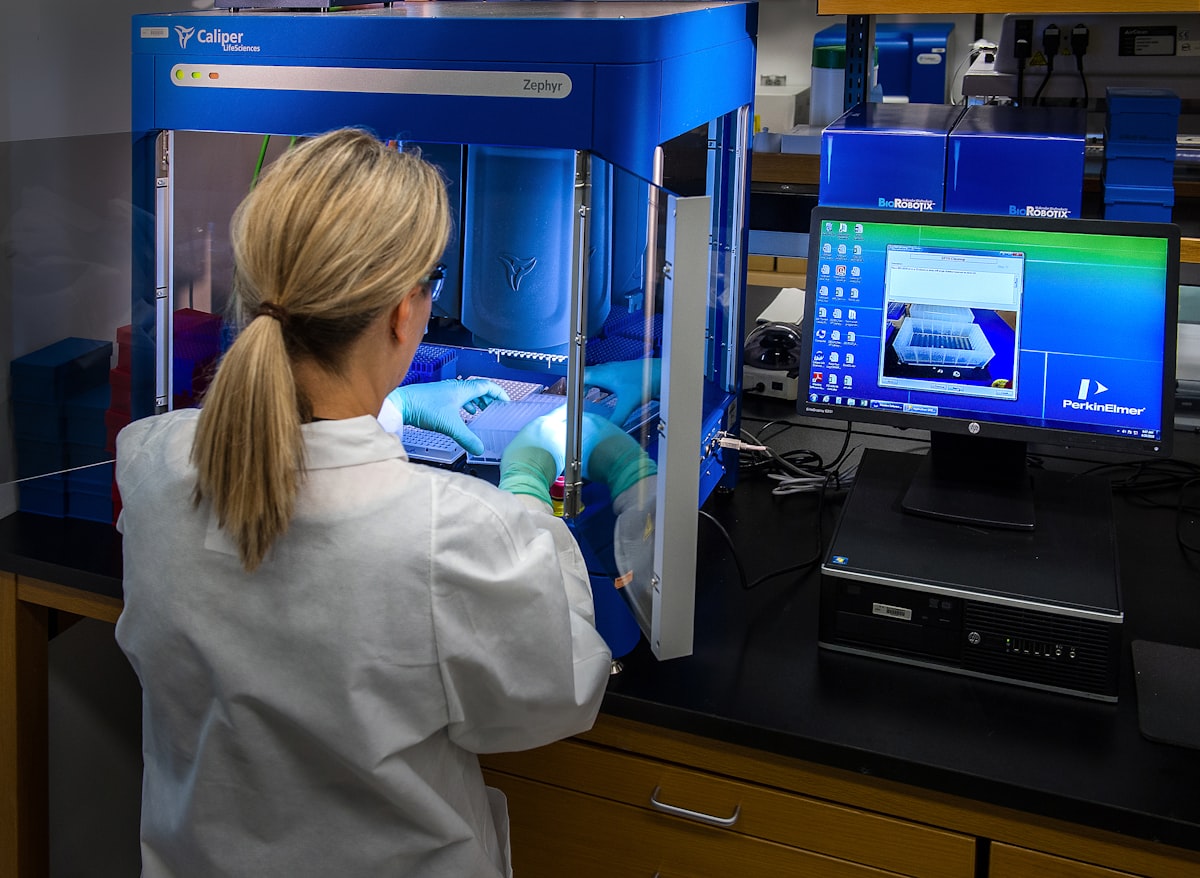
The global lab automation market is projected to reach $7.1 billion by 2028–but most lab automation today refers to robotic systems, storage and retrieval systems, workcells, and other equipment. Take liquid handling, a fundamental component of most automation systems. Motorized pipettes or syringes, attached to a robotic arm, dispense specified volumes of sample into wells of a designated container. Human error is reduced, time is saved, and operations are exponentially more efficient.
How we introduce data into the lab automation equation
Who’s left out of these automated processes? Analytical instruments. What if there was a way to establish a direct integration between your liquid handlers and plate readers, and send instructions and sync data back and forth? Well, there is–through Ganymede.
We’ve taken a unique approach that enables us to leverage automation to lab data. Our starting assumption is that biological data will always be complex, and so we’ve focused our efforts on building the best platform to structure this data. But, that’s just one piece of the puzzle. The other has to do with the inherent complexity of scientific workflows. Our answer? Give you the power to design your own business logic that matches exactly the workflows you’re trying to integrate. In the case of the plate reader, you could parse out the data from a run into a clean format, apply manual or automated analysis to the data, and depending on the QC benchmarks you’ve established, this could kick off the next step of the process in the automated workcell, but only for the "QC-approved" sample wells.
And that’s just a single application of our platform. From microscopes and chromatography systems, to flow cytometers and bioreactors, data integration lets you automate all of your analytical lab instruments.
Weaving the web that is HPLC processes
High-performance liquid chromatography (HPLC) is a technique widely used in the separation of substances to identify, quantify, and purify a particular analyte or compound. A typical HPLC system can consist of a “bewildering number of [...] modules”, with multiple layers of hardware and software to execute, analyze, and record experiments. Naturally, this creates many opportunities for error, inefficiency, and improvement.
For one thing, scientists must manually ensure the correct method is loaded in the chromatography data system (CDS), and that the results follow the right path and subdirectory. Scientists are also responsible for inputting the sample identifier on each run, and subsequently recording all results accurately in an electronic lab notebook (ELN) or laboratory information management system (LIMS). Especially in biologics R&D, scientists will be using HPLCs as just one of several analytical tools in a given workflow, further demonstrating the need to be able to combine and integrate all of these data sources together.
Ganymede’s platform virtualizes this complex process by integrating directly with the instrument(s), CDS, and LIMS, automatically pulling and pushing relevant chromatography data to the right directories and feeding all key results into the LIMS. Ganymede can even link relevant metadata like sample identifiers with ease and maintain full traceability of the data across the entirety of the process.
Applying “high-throughput” to plate reader data
UV-Visible spectrophotometers (also known simply as plate readers) make use of light in the visible and ultraviolet sections of the spectrum, providing insight into the properties of compounds and analytes in a sample. It’s essential for carrying out that most ubiquitous of assays– the ELISA.
Despite the standardized formats of plates going into plate readers (typically 96 wells), the data coming out of them varies in surprisingly unstructured forms. And, with that many samples on just one plate, manual data management and analysis quickly becomes burdensome. Now imagine what life is like for those running plate after plate in high throughput screening workflows. Factor in outlier values popping up and experimental errors, and the value of applying automation becomes clear. With structured plate reader data and the right Python scripts in Ganymede, repetitive calculations like IC50s can be automated away. Automated data analysis can also provide more accurate results compared to manual analysis. This can help researchers identify important features and trends in plate reader/spectrophotometer data that may be difficult to detect otherwise.
Making the most of each bioreactor run
Speaking of scale, what about bioreactors? Typically used to culture large volumes of proliferating cells, they also result in large volumes of data to manage, transfer, store, and process. At the very least, it needs to be organized to meet GxP compliance. Practically, it also needs to be annotated with sensor data and metadata providing context of key events and structured to be able to run advanced analytics solutions and ML models. Downstream, the bioreactor data needs to be interpreted alongside manual records from QC instruments and process development efforts, and deposited in a LIMS for tracking. Bioreactors may seem like they’ve been “solved” in the industry. But, especially at the smaller scale associated with cell therapies and nascent synthetic biotechnologies, there’s plenty of room for “growth”.
With Ganymede, you can apply automation to maximally streamline and standardize an expensive and delicate process. Eliminate the costly manual gaps that exist in bioreactor runs. Raw data can be automatically enriched with metadata, processed, and stored in our data lake with full traceability. Every intermediate table of processing and analysis is saved, so you can query them at any time. Easily screen numerous growth conditions and optimize runs with automated analysis. Dynamically see how your current run compares against historical data, and modify conditions real time. Have full visibility into the R&D efforts and historical data tied to each bioreactor run to ensure reproducibility. Best of all? No more paper records and reports required.
Mitigating issues with imaging data
Imaging is an interesting use case for data automation, in that it lets you tackle two, seemingly unconnected problems with such data sets: storage and reproducibility. Imaging data is notoriously large and difficult to manage efficiently. It’s also open to subjective interpretation and a lack of traceability on what analysis steps were done. Live cell imaging systems and confocal microscopes, for example, are common sources of imaging data headaches.
Never worry again about tediously managing imaging data: Ganymede automatically saves it right off the instrument on the cloud, purpose-built for high performance data archiving. What’s more, we enable you to automatically access imaging files in deep storage with the simple click of a link uploaded into your ELN or LIMS. A Ganymede-powered integration with your microscopy device ensures every image is tagged accurately with rich metadata like the time stamp, light source, power density, excitation / emission wavelength bandwidth, and hardware information. To enforce reproducibility and enable scale, automated analysis like live cell number calculation can be applied, saving each of the intermediate steps and outputting desired quantities. Image processing is also a key component in enhancing and analyzing cell images. Steps like image alignment and deconvolution can be automated to reduce the time spent on processing.
“Unclogging” flow cytometry automation plans
Flow cytometers detect and measure the cell biology (physical and chemical characteristics) of subsets of a cell population. In other words, they’re essential to any lab studying mammalian cells. By some miracle, the data that comes off them is highly standardized - the FCS or “Flow Cytometry Standard” file. And yet, they seem to consistently stump automation efforts. For one, though files are not large with regards to storage space, each sample within a file generates thousands of data points. As with most high throughput workflows, flow cytometry often requires lots of manual movement of data. Crucially, analyzing these files almost always requires manual intervention, and this is where automation faces a problem. Flow cytometry data analysis involves gating, which is the process of selecting cells of interest based on their physical and/or chemical properties, and is very difficult to automate in a relevant and reliable way.
The team here at Ganymede has uniquely cracked the code on flow cytometry automation. What we’ve solved for is the need for customization in deciding when to apply automation in flow cytometry workflows. You can apply automation in the standard way for easily pulling and parsing FCS files into the cloud with one of our flows. Ganymede though allows for both automated gating and human in the loop manual analysis. The former is done by giving you the keys to decide how you want to run automated gating (for example, Gaussian mixture models), and can be fully customized by the user. The latter is expedited with easy access to annotated FCS files and automated acquisition of the resulting workspace (WSP) files. Key results and statistics can then be automatically parsed from the WSP file and outputted to your ELN or LIMS of choice with Ganymede’s pre-built connectors.
Automate your entire lab with cloud-controlled data flows
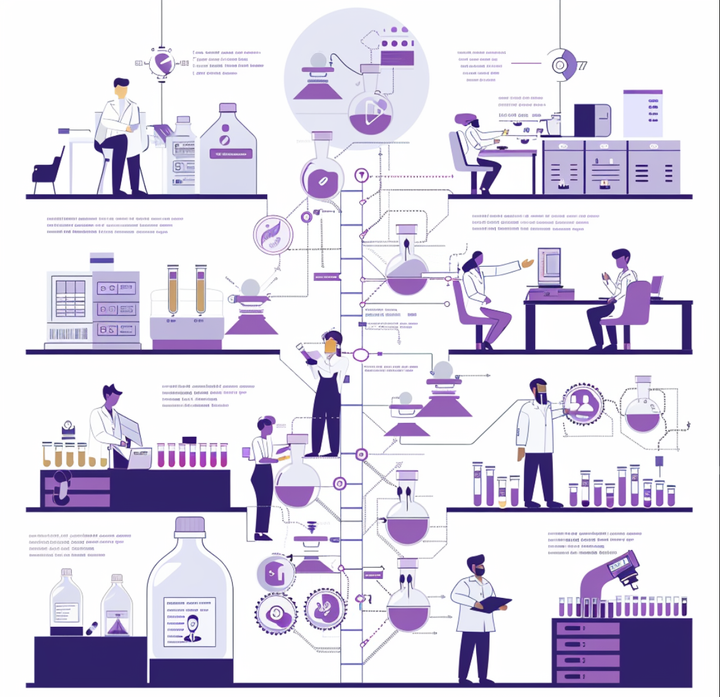
The Ganymede platform brings unparalleled flexibility to whole-lab integration. With our large no-code library and rapid way of building new integrations, Ganymede can connect to almost any instrument, database, and application. Critically, we give you the power to not just structure/ETL your data, but to design the business logic of the data flows. This uniquely allows users to apply automation to their lab data across virtually every possible use case.
Have an instrument you’d like to automate? Let us help you.


